The COVID-19 pandemic has been especially disruptive for high-contact industries, including the $139 billion dental industry. To better understand the economic impact of COVID-19 on the dental industry, SoftwarePundit and Dental Intelligence analyzed the performance data of 3,600 dental practices.
Dental practice revenue declined 6% year over year in 2020
The study found that overall dental practice revenue declined by 6% in 2020. This is significantly less than the 38% decline the ADA projected in June.
The effect of COVID-19 is clear when looking at a month-by-month analysis of dental practice performance. Scheduled dental appointments started the first two months of 2020 8% above 2019 performance. However, when mandated shutdowns occurred, hygiene appointments dropped significantly. On average, dental practices completed 47% fewer hygiene appointments in April 2020, compared with April 2019.
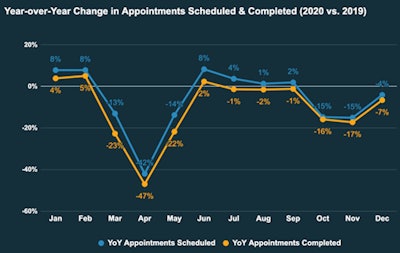
Interestingly, performance rebounded quickly in June and July. On average, dental practices scheduled 8% more hygiene appointments in June 2020 than in the same period a year earlier.
"The second quarter of 2020 was really tough, but a lot of practices bounced back after reopening," said Dr. Kaori Ema of Printers Row Dental Studio. "I'm sure impact varied based on the area and situation -- for example, urban areas where there's a lot of businesses but no residents were hit hard. However, as a result of the stimulus money and [Paycheck Protection Program], some practices were actually better capitalized than before COVID."
The economic effect of COVID-19 was consistent across regions
SoftwarePundit also analyzed the effect of COVID-19 on dental practices by region. The company found that, overall, all regions in the U.S. has a similar experience.
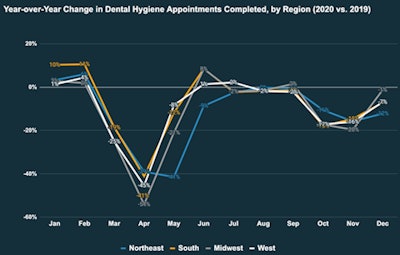
There were a few notable regional differences in hygiene appointments completed:
- In the Northeast, the initial decline in appointments extended into May and June, and the fall decline was not as severe.
- The Midwest experienced the greatest decline in appointments in both the spring and the fall.
- The South had the most individual months of at least 5% year-over-year growth.
In contrast, performance varied widely on a state-by-state level. On average, dental practices in the U.S. completed 10% fewer hygiene appointments in 2020.
Kansas and Arizona were the only two states to experience an annual increase in hygiene appointments. Dental practices in Kansas completed 5% more hygiene appointments in 2020 than in 2019. Arizona practices completed 2% more.
Dental practices in other states experienced far more severe effects. Alabama, New York, Washington, and New Hampshire all experienced a greater than 20% decline in year-over-year hygiene appointments. Ten other states experienced a 15% to 20% decline.
The pandemic has exacerbated the performance gap among dental practices
Data from Dental Intelligence were also used to understand how the pandemic affected the top and bottom dental practice performers. Several key metrics told the same story: Winning practices did better in 2020 than in 2019, while the worst performers did worse.
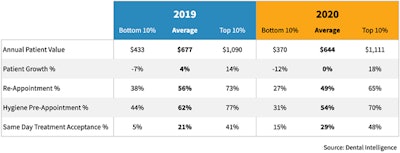
The top 10% of practices actually performed better in 2020 in terms of average patient value and patient growth. In contrast, the bottom 10% of practices performed worse in 2020 for both metrics. Overall, dental practices saw zero patient growth in 2020.
Leading indicators suggest that recovery is still underway
SoftwarePundit analyzed key performance indicators to better understand how quickly dental practices are likely to make a full recovery. Data suggest that while dental practices have recovered from the most challenging conditions in the second quarter of 2020, recovery is still underway.
Hygiene preappointment percentage is the percentage of active hygiene patients (patients seen within the past 18 months for a hygiene appointment) who currently have a scheduled hygiene appointment. On average, dental practices had a 13% lower hygiene preappointment percentage in 2020 than in 2019.
Reappointment percentage is the percentage of hygiene visits that schedule a subsequent hygiene appointment before leaving the dental office. The average reappointment percentage fell from 56% in 2019 to 49% in 2020. This 12.5% decline in reappointment percentage indicates that dental practices might have emptier appointment calendars in the months ahead.
Survey data from the ADA Health Policy Institute confirms this outlook. In a survey of 70,000 practices, the ADA found that 10% of all dental practices had to downsize their teams between January 15 and February 15, 2021. In addition, 16.5% had to reduce their team's work hours and 3% had to reduce wages or benefits.
While the data from Dental Intelligence suggest that COVID-19's economic effects were not as severe as expected, there is no question that the virus led to an extremely challenging business environment for dentists. Practices should be proud of the hard work that's been done to keep patients healthy and their businesses operating.
The full study is available on SoftwarePundit's website.
Bruce Hogan is co-founder and CEO of SoftwarePundit, a technology research firm that provides advice, information, and tools to help dental practices successfully adopt technology. From highlighting industry-specific trends to delivering extensive software guides, SoftwarePundit helps dental practices select the best software for their needs.
The comments and observations expressed herein do not necessarily reflect the opinions of DrBicuspid.com, nor should they be construed as an endorsement or admonishment of any particular idea, vendor, or organization.
