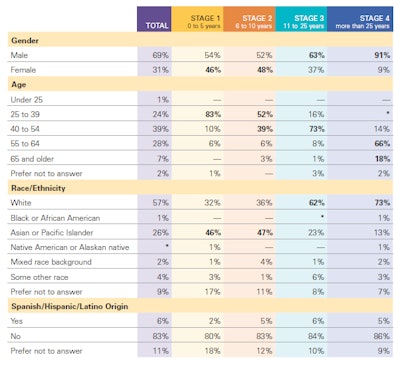
Demographics, by stage of practice, California, 2010Aug 30, 2010 *Less than 1%. Note: Bold numbering indicates significant difference at 95% confidence level. Source: Dental Health Information Technology Survey. Edge Research. April 2010. close Latest in HomeMore details emerge involving the death of dentist and wifeJanuary 9, 2026Dentist with long disciplinary history, now 79, agrees to surrender his licenseJanuary 9, 2026SponsoredWebinar: The 2026 Practice Upgrade BlueprintJanuary 7, 2026The economic and legislative shifts shaping practice salesJanuary 9, 2026