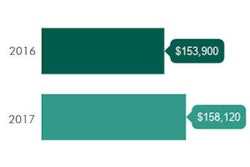
What is your practice's gross production by dentist? If the last four months of 2017 are anything like the first eight months of the year, dental practices around the U.S. should benefit from their finest year since the dawning of this decade.
We recently extracted data from Sikka's collection of numbers taken from Sikka Software that has been collected from more than 12,500 U.S. dental practices. We looked specifically at the gross production by the dentist during the first eight months of the calendar year. Here are the average numbers discovered from January through August from 2010 through 2017 per dentist per practice (see table below).
| U.S. gross production per dentist January through August | |
| Year | Gross production per dentist ($) |
| 2010 | $38,487.96 |
| 2011 | $38,680.15 |
| 2012 | $38,914.22 |
| 2013 | $39,393.72 |
| 2014 | $39,451.40 |
| 2015 | $40,722.33 |
| 2016 | $42,542.39 |
| 2017 | $44,731.16 |
Continuing upward trend
Numbers from 2017 are trending higher than 2016, continuing an upward trend that has been in existence since 2010. However, the jump in gross production from 2015 to 2016 and 2016 to 2017 has been higher than at any previous time in the decade.
So what is causing the jump over the last two years? We asked Jan Keller of Jan Keller Dental Consulting for her thoughts. She believes the numbers show that those who invested in systems are seeing their hard work pay off.
"In the past eight years, practices that had invested in time to educate their team on the systems in place to handle financial arrangements, insurance, continuing care, scheduling, and treatment acceptance experienced increases in both production and collection," Keller said.
She also cited the importance of monitoring practice numbers and setting goals.
"These might have even been small changes, but the dentists and team members who took the time and effort to constantly monitor their numbers and benchmark critical areas allowed for the practice to make modifications to the systems, which contributed to the improvements and increases," Keller said.
Keller also believes it's not just about crunching numbers but basking in the small victories along the way as well
"I know practices who celebrate their victories and milestones; it makes a world of difference for their team members and the environment within the practice," Keller said. "If you're only watching numbers but not giving updates and high fives along the way, you are missing a key part of the team feeling like they are an integral part of the growth of the practice."
Today's technology has made a difference for dental practices, Keller noted.
"Another area that helped practice realize this increase was the embracing of technology and the use of social media to market their practice," she said. "The younger generation is using social media and technology to guide them in the decision-making process and also to connect with their patients more closely than ever before."
Alitta Boechler is the director of digital marketing at Sikka Software. You can contact her at [email protected]. Get a head start on 2018 with a free 10-procedure fee survey for your ZIP code from the app Practice Mobilizer at www.practicemobilizer.com. Or you can check out store.sikkasoft.com to consider purchasing full fee survey with more than 600 procedure codes for three ZIP codes.
Please note that the data should be used for comparison only.
The comments and observations expressed herein do not necessarily reflect the opinions of DrBicuspid.com, nor should they be construed as an endorsement or admonishment of any particular idea, vendor, or organization.


