As we reach the final month of 2020, we can all look back and see just how much COVID-19 has affected our industry and our society. However, data recently obtained from Sikka Software show just how many highs and lows dentistry has endured during these pandemic-filled past few months.
The chart below was created using data from more than 10,000 dental practices throughout the U.S., and it's easy to see the wild ride many dental practices have endured this year. For the sake of this article, we asked Sikka's data team to focus on two parts of the dental practice: dental hygiene and placement of crowns.
The blue line in the chart represents the number of hygiene visits in 2020, while the orange line represents the number of crowns. The corresponding weeks of the year are listed at the bottom.
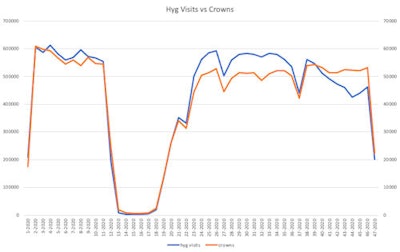
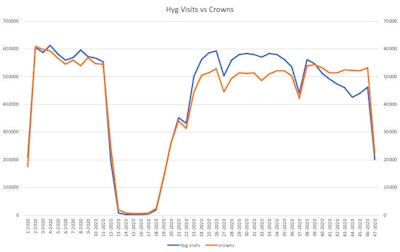
Image courtesy of Sikka Software.
The high point for hygiene this year came in the second week, with 605,190 visits, while the low point came in the 15th week (early April), with 2,977 visits, as dental practices were primarily only seeing emergency patients. Since reopening, hygiene visits have not crossed 600,000 again.
Meanwhile, the number of crowns was also the highest in mid-January, at 60,839, while just 604 were placed in early April. The number of crowns has only gone over 54,000 once since practices reopened.
"What this data shows is very similar to the messaging we are hearing from the American Dental Association's Health Policy Institute," said Sikka Software founder and CEO Vijay Sikka. "We know that there is still a ways for the dental industry to go to return to the prepandemic levels. That's why we believe it is so important for dental practices to look now at their business models for 2021 and how they can achieve maximum productivity."
Did these numbers surprise Sikka when he saw them?
 Vijay Sikka.
"I wouldn't say they were a surprise, because we've been hearing from our clients just how devastating the shutdown was," Sikka said. "I also choose to look at them as a way that dental practices can judge their own successes in 2020 versus this national average, or see where they fell short and can improve heading into next year."
What else has Sikka seen in some of the recent data his company has collected?
"We are starting to see a drop of close to 20% in preventative and diagnostic procedure revenue. This is indicative of a drop in revenue for most practices," Sikka said. "To compensate for this, we advise practices to immediately update their fees and continue to maintain their practice profitability and revenue consistency/offset loss."
As a note, Sikka Software offers information on fees as a part of its business.
The comments and observations expressed herein do not necessarily reflect the opinions of DrBicuspid.com, nor should they be construed as an endorsement or admonishment of any particular idea, vendor, or organization.
