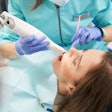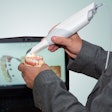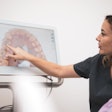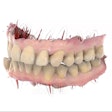
When you are preparing a tooth to receive a crown, your intraoral scanner has to have a high degree of accuracy. But, when comparing scanners for your office, how do you know which would be the most accurate for your purposes?
Researchers compared two intraoral scanners to find out if measuring noise was a valid way to approach judging these scanners. They reported that while no statistically significant differences were found in the mean measurements between the two scanners, there was more noise the farther away from the center of the object being scanned.
"Detected noise is significant near image border, but smaller in the center," the authors wrote.
The study was led by Alban Desoutter from the Laboratory of Bioengineering and Nanosciences at Montpellier University in France.
True images
For intraoral scanners, the most difficult challenge is to reproduce the surface of what is being scanned with high fidelity. One way of determining the accuracy of a scanner is to measure its "noise" or how true of an image a 3D scanner creates. The noise value highlights the capacity of a scanner to allow the practitioner to efficiently and accurately plan treatment. However, there is no accepted procedure to evaluate the performance of these scanners. The researchers sought to compare two intraoral scanners while developing a reproducible method for determining the accuracy of these scanners.
“Evaluation of intraoral scanners' trueness is equivalent to measuring the additional noise to the signal.”
"Evaluation of intraoral scanners' trueness is equivalent to measuring the additional noise to the signal," the authors wrote.
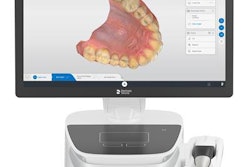
The researchers compared two intraoral scanners: the CS 3500 (Carestream Dental) and the 3Shape Trios (3Shape). Rather than use extracted teeth, the researchers used an ultraflat, ultrasmooth alumina wafer. This wafer can be considered an almost totally flat surface, making it useful in measuring intraoral scanner resolution.
The researchers used the scanners to take images of the wafer from three angles: 0° (wafer perpendicular to light source), 30°, and 45°.
The wafer was recorded in two directions for the 30° and 45° angles:
- Slope in the extension of intraoral scanner
- Slope in the other direction, to the handle of the intraoral scanner
Each of the five positions was recorded 10 times, creating 50 raw meshes, or collections of edges, faces, and vertices that are created by software. The noise for each scanner was measured by root mean square (RMS) values in micrometers. The researchers looked at values for the whole mesh and the central part.
For the entire mesh, noise measurements varied between 5.29 µm and 10.68 µm for the CS 3500 and between 6.79 µm and 12.58 µm for the Trios scanner. However, when considering noise near the images' border, the researchers found a statistically significant difference. As the table shows, they reported that the detected noise is significant near the border of the mesh but smaller in the center.
| Overall noise levels | ||
| Carestream CS 3500 | 3Shape Trios | |
| RMS central part (µm) | 6.18 | 2.83 |
| RMS whole wafer (µm) | 8.01 | 8.86 |
| Noise at 0° | 7.54 | 6.79 |
| Noise at 30° (range) | 8.80-10.68 | 7.89-9.87 |
| Noise at 45° (range) | 5.29-7.74 | 8.86-12.58 |
"Thus, we have a clear 'edge effect' with the two intraoral scanners," the authors wrote. "This was never reported previously."
Noise reduction needed
For study limitations, the authors noted that it was not possible to determine where the measured noise originated, so they suggested that other methods must be introduced in the CAD/CAM system to evaluate intraoral scanner performance. A more specific investigation must be conducted to determine if this noise signal is due to intraoral scanner chromatic aberration or a software effect.
The authors also noted that scanner trueness and precision need to be studied as well to fully understand a scanner's accuracy, they added.
The authors concluded, however, that this test was an effective way to test for scanner noise.
