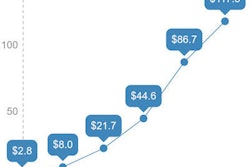
Spending on dental and oral healthcare in the U.S. increased to more than $113 billion in 2014, a 2.8% increase from 2013, according to a new study in Health Affairs.
The growth in spending on dental care did not match the overall growth in healthcare spending, which increased 5.3% to $3 trillion in 2014. The study authors noted that this worked out to more than $9,500 per person (Health Aff, December 2, 2015).
“The acceleration was due to stronger growth in private health insurance spending.”
"Dental spending rose 2.8% in 2014 following growth of 1.5% in 2013," study co-author Joe Benson, MBA, an economist in the Office of the Actuary at the Centers for Medicare and Medicaid Services (CMS), told DrBicuspid.com. "The acceleration was due to stronger growth in private health insurance spending (which accounted for 48% share of total spending and increased 3.4% from 1.3% in 2013) and Medicaid spending (which accounted for 9% share of total spending and increased 14.0% from 2.6% in 2013)."
Spending growth for these payors was largely influenced by the coverage expansions associated with the Patient Protection and Affordable Care Act (ACA), he added.
Benson also noted that expenditures on dental care are expected to continue to increase.
"Earlier this year our office released projected national health spending for 2014 to 2024," he stated. "Dental spending was projected to increase at an average annual rate of 4.8% during the period 2015 to 2024, which is higher than the average annual rate of 1.8% over the last six years."
Growth per capita
The authors attributed this acceleration in health spending growth in 2014 to faster growth in private health insurance and Medicaid spending in 2014, compared with 2013, and also growth in spending on retail prescription drugs.
Growth per capita was 4.5%, which can be broken down as follows:
- Changes in the age and sex mix of the population accounted for 0.6 of a percentage point.
- Medical price inflation accounted for 1.8 percentage points.
- Change in residual use and intensity accounted for the remaining 2.1 percentage points.
The study authors accumulated figures from the National Health Statistics Group from CMS' Office of the Actuary and the U.S. Department of Commerce's Bureau of Economic Analysis and Bureau of the Census. They emphasized that data from CMS are considered the most reliable.
| National health expenditure (NHE) amounts and annual growth for 2008-2014, in dollars |
|||||||
| Spending category | 2008 | 2009 | 2010 | 2011 | 2012 | 2013 | 2014 |
| NHE, billions | 2,402.6 | 2,496.4 | 2,595.7 | 2,696.6 | 2,799.0 | 2,879.9 | 3,031.3 |
| Health consumption expenditures | 2,254.6 | 2,357.5 | 2,452.9 | 2,547.1 | 2,645.8 | 2,727.4 | 2,877.4 |
| Personal healthcare | 2,013.9 | 2,115.9 | 2,194.1 | 2,280.4 | 2,371.8 | 2,441.3 | 2,563.6 |
| Hospital care | 727.6 | 778.1 | 817.6 | 853.2 | 902.7 | 933.9 | 971.8 |
| Physician & clinical services | 483.7 | 500.5 | 516.4 | 540.9 | 563.0 | 576.8 | 603.7 |
| Dental services | 101.9 | 102.3 | 105.0 | 107.1 | 108.9 | 110.4 | 113.5 |
| Annual growth in healthcare spending | |||||||
| Category | 2008 | 2009 | 2010 | 2011 | 2012 | 2013 | 2014 |
| NHE | 4.6% | 3.9% | 4.0% | 3.9% | 3.8% | 2.9% | 5.3% |
| Health consumption expenditures | 4.5% | 4.6% | 4.0% | 3.8 3% | 3.9% | 3.1% | 5.5% |
| Personal healthcare | 4.9% | 5.1% | 3.7% | 3.9% | 4.0% | 2.9% | 5.0% |
| Hospital care | 5.2% | 6.9% | 5.1% | 4.3% | 5.8% | 3.5% | 4.1% |
| Physician & clinical services | 5.5% | 3.5% | 3.2% | 4.7% | 4.1% | 2.5% | 4.6% |
| Dental services | 5.1% | 0.4% | 2.7% | 2.0% | 1.6% | 1.5% | 2.8% |
In 2014 households and the federal government accounted for the largest shares of spending (28% each), followed by private businesses (20%), and state and local governments (17% total).
Private insurance growth
Total private health insurance spending increased 4.4% to more than $990 billion in 2014, according to the study. The study authors noted that a number of ACA provisions became effective in 2014, including the following:
- The implementation of Marketplace plans
- The introduction of health insurance premium tax credits
- New health insurance industry fees
- Mandated changes to benefit designs
These provisions combined to create "upward pressure" on 2014 private health insurance spending growth.
Surprisingly, the authors found that per enrollee Medicaid spending declined at a rate of 2.0% in 2014 after growing 4.1% in 2013.
"The newly insured tended to be lower-cost adults and children," said co-author Anne B. Martin, also an economist in the Office of the Actuary, on a December 2 conference call.
ACA
The return to faster growth in national healthcare expenditures "was largely influenced by the coverage expansions of the Affordable Care Act," the study authors concluded.
"But how the health sector responds to the evolving access and incentive landscape, as well as underlying economic conditions, will determine the future trajectory of health spending growth," they noted.


