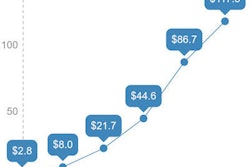
Spending for dental care will grow 60% during the next decade, according to a new report in Health Affairs. Spending for dental services was $97.3 billion in 2007 and is projected to grow from $114.5 billion in 2014 to $183.4 billion in 2024. This mirrors a projected growth in overall healthcare spending from $2.3 trillion in 2007 to $5.4 trillion in 2024.
Increased healthcare expenditures will be driven by economic growth following the recession, rising insurance premiums, and higher cost sharing in employer-sponsored health insurance plans, according to the study authors (Health Affairs, August 2015, Vol. 34:8, pp. 1707-1417).
They noted that overall spending growth is primarily due to several factors:
- Costs related to the Patient Protection and Affordable Care Act (ACA)
- Economic growth that has rebounded since the recession
- The aging of the population, especially the baby-boomer generation
During the next decade, spending on healthcare is expected to grow 5.8% annually, rising to $5.4 trillion by 2024. Healthcare spending as a share of the economy is expected to grow from 17.4% in 2013 to 19.6% in 2024.
As nearly 4 out of every 10 healthcare dollars will be spent on people enrolled in Medicare and Medicaid as the U.S. population ages, the authors anticipate faster growth in spending per beneficiary. They project the share of health expenses paid for by federal, state, and local governments is projected to increase to almost half over the projection period.
Spending projections for national healthcare for 2014-2024 were based on the annual forecast of the U.S. Centers for Medicare and Medicaid Services (CMS) and the National Health Expenditure Accounts.
Overall spending
The study's lead author, CMS economist Sean Keehan, explained the ACA's dramatic impact on healthcare spending.
“We're projecting faster growth in health spending over the next decade reflecting expanded insurance coverage under the ACA, expectations of continued improvements in the economy, and population aging.”
"After six years of national health spending growth hovering near historically low rates, we're projecting faster growth in health spending over the next decade reflecting expanded insurance coverage under the ACA, expectations of continued improvements in the economy, and population aging," Keehan stated in a press release. "However, these projected growth rates are significantly lower than those observed over the three decades prior to the recent recession."
Primarily as a result of the eligibility expansion under the ACA, Medicaid spending grew 12% in 2014, and total Medicaid enrollment increased 13% to 66.5 million people. While the elderly and individuals with disabilities represent the smallest proportion of people enrolled in the Medicaid program, they account for the majority of spending, the study authors wrote. Slower growth rates in Medicaid reflect stable economic conditions and lower unemployment.
The share of national health spending paid for by Medicare is projected to rise from 20.1% in 2013 to 22.5% in 2024. This is caused by an expected increase in enrollment of 19.1 million elderly Americans in the next decade and faster spending that results from the aging of beneficiaries. During this time, the insured share of the U.S. population is expected to rise from 86% to 92.4%, the authors wrote.
Out-of-pocket expenses
The study found that medical price inflation was 1.4% even with an increased number of people getting health coverage in 2014. However, the authors reported that, with increases in coverage, the share of health expenses that Americans pay out of pocket is projected to decline from 11.6% in 2013 to 10% in 2024.
Growth rates in private health insurance spending (6%) is mostly due to increased enrollment in the new health insurance marketplaces.
| National health expenditures (NHE) Amounts (in billions) by spending category, 2007 to 2024 |
|||||||
| Spending category | 2007 | 2012 | 2013 | 2014 | 2015 | 2018 | 2024 |
| Total NHE | $2,303.9 | $2,817.3 | $2,919.1 | $3,080.1 | $3,243.5 | $3,785.5 | $5,425.1 |
| Health consumption expenditures | $2,158.8 | $2,653.6 | $2,754.5 | $2,915.3 | $3,075.9 | $3,593.8 | $5,154.2 |
| Personal healthcare | $1,921.0 | $2,379.3 | $2,468.6 | $2,596.3 | $2,728.6 | $3,184.3 | $4,550.1 |
| Physician & clinical services | $461.8 | $565.3 | $586.7 | $615.0 | $640.3 | $735.5 | $1,034.8 |
| Dental services | $97.3 | $110.0 | $111.0 | $114.5 | $119.1 | $134.6 | $183.4 |
| Annual growth by spending category, 2007 to 2024 | |||||||
| Total NHE | 7.3% | 4.1% | 3.6% | 5.5% | 5.3% | 5.3% | 6.2% |
| Health consumption expenditures | 7.3% | 4.2% | 3.8% | 5.8% | 5.5% | 5.3% | 6.2% |
| Personal healthcare | 7.2% | 4.4% | 3.8% | 5.2% | 5.1% | 5.3% | 6.1% |
| Physician & clinical services | 6.7% | 4.1% | 3.8% | 4.8% | 4.1% | 4.7% | 5.9% |
| Dental services | 6.9% | 2.5% | 0.9% | 3.2% | 4.1% | 4.1% | 5.3% |
