Spending on dental care in the U.S. increased by almost 3% annually between 1996 and 2013. While that increase adds up to $38 billion, it fell short of growth in spending on other health conditions, according to a new study in the Journal of the American Medical Association.
Spending on dental care grew at a relatively low rate of 2.88% over the years studied, the study authors reported. This compares to a growth rate of 4.0% for overall healthcare spending over a comparable time period and rates topping 6% for some health conditions, such as diabetes treatment and care for low-back and neck pain.
"Understanding the factors associated with healthcare spending increases, and their variability across conditions and types of care, can inform policy efforts to contain healthcare spending," they wrote (JAMA, November 2017, Vol. 318:17, pp. 1168-1678).
The lead study author was Joseph Dieleman, PhD, of the Institute for Health Metrics and Evaluation, an independent global health research center at the University of Washington in Seattle.
Increased prices
The U.S. spends more money on healthcare than any other country per year, according to the researchers. This spending increased by more than $900 billion from 1996 to 2013 and accounts for almost 20% of the U.S. economy.
The researchers reported that inflation-adjusted annualized change in spending for oral disorders was 2.88%, which is lower than other conditions studied (see chart below).
| Annual growth rate in spending in U.S. by health condition | |
| Category | Annualized rate of spending increase (%) |
| Oral disorders | 2.88% |
| Retail pharmaceutical | 5.60% |
| Diabetes care | 6.13% |
| Emergency department | 6.40% |
| Low back and neck pain | 6.47% |
But knowing the amounts of spending increases is not helpful if the causes of these increases are unknown. To understand what is driving these increases, the researchers examined the following five factors to see which had the greatest effect:
- Population growth
- Population aging
- Disease prevalence/incidence
- Service utilization
- Service price and intensity
The researchers looked at dental spending and also examined spending on inpatient and ambulatory care, as well as retail pharmaceuticals, nursing facility, and emergency department spending.
They used data from the U.S. Disease Expenditure 2013 project (JAMA, December 2016, Vol. 316:24, pp. 2627-2646) and the Global Burden of Disease 2015 study (Lancet, October 2016, Vol. 388:10053, pp. 1545-1602). From more than 150 health conditions, 36 age and sex groups, six types of care, and 18 years of the data, they focused their research on the five factors listed above.
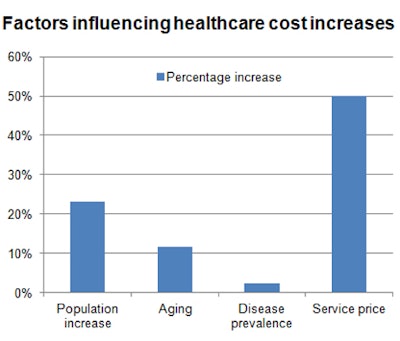
The researchers found that overall, and for dental care, more than half of the spending increase was attributed to increased prices for healthcare services. They also noted contributions from growth and aging of the U.S. population.
"Across all types of care and health conditions, increases in service price and intensity had the strongest associations with the total spending increase," the authors wrote.
Across all categories, not just dental spending, service price and intensity were responsible for half of the increase in spending, or $583.5 billion, according to the researchers (see chart below).

Specifically focused on dental spending, the researchers wrote that changes in service price and intensity were positively associated with the spending increase of more than $38 billion.
The authors, however, noted several limitations to their study:
- The estimates from the Disease Expenditure project were not separated by payor. Because public payors often pay lower prices than private or out-of-pocket payors, performing this analysis by payor could yield important insights.
- Data on spending and disease burden were only captured at the national level.
- Data used for this study did not allow service price and intensity to be disaggregated into the individual components of changing service prices, intensity, and technology.
- The estimates produced by the Disease Expenditure project only extended to 2013. The healthcare system is dynamic, and patterns may have changed.
Studying these factors can influence future policy efforts, the authors concluded.
"Understanding these factors and their variability across health conditions and types of care can inform policy efforts to contain healthcare spending," they wrote.
What can be controlled
“The study again underscores that the United States is on an unsustainable growth path in terms of healthcare costs.”
Roger P. Levin, DDS, the founder and CEO of Levin Group, was asked if this increase in dental spending was sustainable over the next five years.
"No, I do not see this pricing increase as sustainable over the next five years at the same rates," he wrote in an email to DrBicuspid.com. "While fees might remain relatively stable at current levels (or experience slight increases), we are rapidly reaching a ceiling. The public will not tolerate significantly increased fees and will seek practices that offer lower fees or participate with lower reimbursement insurance plans, most of which are now offering much lower reimbursements to the practice."In an editorial accompanying the article, Patrick Conway, MD, president and CEO of Blue Cross Blue Shield of North Carolina, wrote that the findings from this report have important implications for U.S. policy, payors, hospitals and clinicians consumers, and others (JAMA, November 2017, Vol. 318:17, pp. 1657-1658).
"The study again underscores that the United States is on an unsustainable growth path in terms of healthcare costs and must get costs under control, and highlights several of the potential levers," he wrote.
As some factors were not able to be modified, it was important to focus on what can be controlled, he noted.
"The report by Dieleman et al highlights that more than one-third of the annual increase in spending -- that attributable to aging and growth of the population -- is likely not modifiable, making it even more important to focus on the two-thirds of spending increases that is potentially modifiable," Dr. Conway wrote.


